






Oway
Request a DemoLog In

Industries / Retail, CPG and Food

Oway for Retail, CPG and Food

Retail, CPG and food companies win on availability and cost to serve. Oway connects sales, inventory and distribution, then moves product on capacity already in motion.

Request a DemoStart Free

Log in now and access Oway OS and Juno for free.

CloudKitchensNP NutraVybesDe la Calle
Retail, CPG and Food
Use case

Replenishment

Plan store and customer replenishment on live sales, inventory and capacity.

  • Replenishment planned on live sell-through
  • Inventory positioned before demand peaks
  • Fewer stock-outs at the shelf
IOIJuno
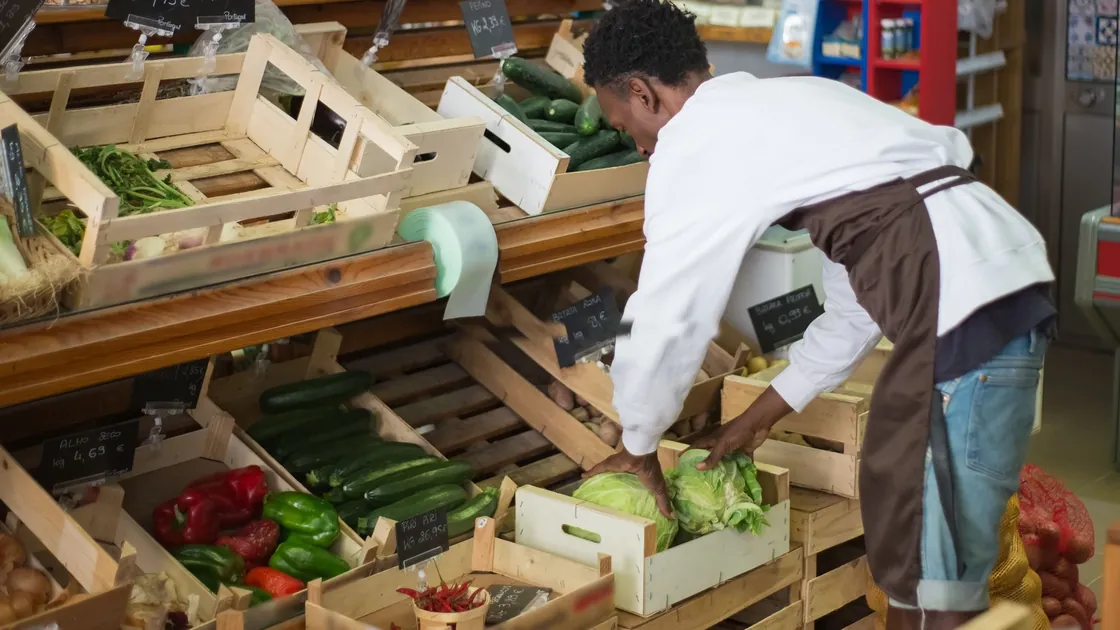
Grocery worker replenishes fresh vegetables in wooden display crates.
Stock-outs across storesStock-outs per week · Illustrative data
50100150200250W1W3W5W7W9W11W1274Oway connected
Stock-outs across stores
Stock-outs
W1212
W2198
W3224
W4205
W5171
W6139
W7118
W8101
W992
W1084
W1179
W1274
Use case

Distribution center throughput

Balance inbound, storage and outbound across every DC.

  • Throughput by DC, shift and door
  • Labor matched to the flow of work
  • Volume rebalanced between DCs
IOIOway OS
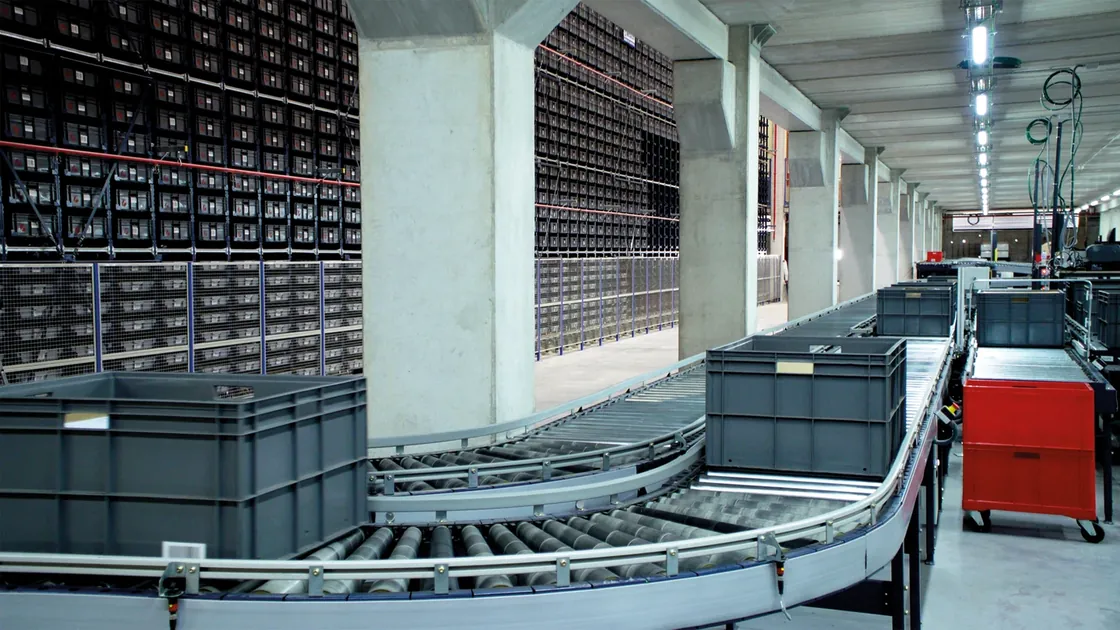
Storage totes travel along a curved roller conveyor beside warehouse shelving.
Pallets per labor hour by DCPallets per labor hour · Illustrative data
Coppell14.2Vernon12.8Fresno11.6Oakland West10.9Phoenix8.4
Pallets per labor hour by DC
Throughput
Coppell14.2
Vernon12.8
Fresno11.6
Oakland West10.9
Phoenix8.4
Use case

Partial loads

Ship 1 to 18 pallets on trucks already moving, up to 50% below market.

  • Juno prices every partial in seconds
  • No warehouse transfers
  • Tracked to the receiving dock
JunoOway OS
Partial loads
Cost per shipment by pallet countUSD per shipment · Illustrative data
Typical LTLWith Oway
05001,0001,5002,0002 pallets4 pallets8 pallets12 pallets
Cost per shipment by pallet count
Typical LTLWith Oway
2 pallets420236
4 pallets760412
8 pallets1,340698
12 pallets1,880954
Use case

Product performance

See which products sell, where, and what it costs to get them there.

  • Sell-through by product and region
  • Freight cost per unit sold
  • Margin after delivery by product line
IOI
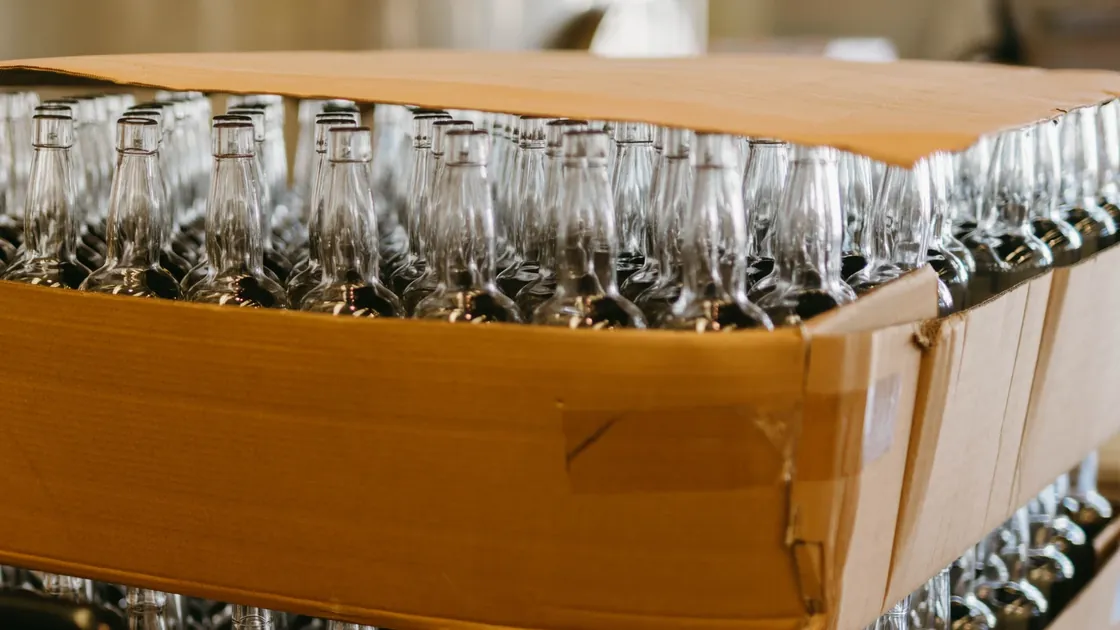
Rows of empty glass beverage bottles stacked in cardboard packaging.
Margin after freight by product lineShare of revenue · Illustrative data
Sparkling34%Energy31%Juice24%Snacks19%Bulk11%
Margin after freight by product line
Margin
Sparkling34%
Energy31%
Juice24%
Snacks19%
Bulk11%
A painting of a long-haul truck on an open road at dusk.

Use Oway for

Tell us about your operation. We’ll show you what runs on Oway.